3 File explanation
3.1 Cover
Calculate range function
| Method | stride |
extension |
|---|---|---|
| logic | fixed step length and stride: anchor = min + (lsmi - 1) × stride |
fixed width and extend: anchor = min + (lsmi - 1) × interval_width |
| overlap method | every stride: interval_width × (1 - overlap) |
fixed point and extend: ± 0.5 × interval_width × overlap |
| original design | Y (from paper) | N (from original author) |
# stride
stride <- interval_width * (1 - percent_overlap / 100)
anchor <- filter_min + (lsmi - 1) * stride
lsfmin <- anchor
lsfmax <- anchor + interval_width
# extension
anchor <- filter_min + (lsmi - 1) * interval_width
extension <- 0.5 * interval_width * percent_overlap / 100
lsfmin <- anchor - extension
lsfmax <- anchor + interval_width + extension
So what’s the difference between stride(papers’) and extension(authors’), according to the original paper, there’s an example below:
- Filter Range: [0, 4.2]
- Interval Length: 1
- Overlap: 20%
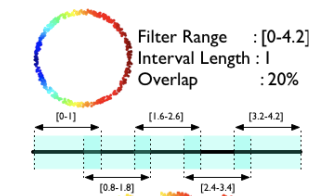
We can easily calculate stride and other variables
# second interval using stride
stride = length × (1 - overlap)
       = 1 × (1 - 0.2)
       = 0.8
anchor = filter_min + (lsmi - 1) * stride
       = 0 + (2 - 1) * 0.8 = 0.8
lsfmin = anchor
             = 0.8
lsfmax = anchor + interval_width
             = 0.8 + 1 = 1.8
For example, The second interval range will be [0.8, 1.8], then you get 0.82, 0.83…. So the final intervals will be same as the original paper performed. But if you use the extension one, you got the different output, the second interval range is [0.9, 2.1], then by doing the same stuff, different anchor will change the intervals.
# second interval using extension
anchor = filter_min + (lsmi - 1) * interval_width
             = 0 + (2 - 1) * 1
             = 1
extension = 0.5 × interval_length × overlap
          = 0.5 × 1 × 0.2 = 0.1
lsfmin = anchor - extension
             = 1 - 0.1
             = 0.9
lsfmax = anchor + interval_width + extension
             = 1 + 1 + 0.1
             = 2.1
3.2 ConvertLevelsets
This file convert flat index and multi index, the reason of converting index is to easily get the range of interval in high dimensional data
to_lsmi <- function(lsfi, num_intervals) {
  # level set flat index (lsfi)
  j <- c(1, num_intervals) # put 1 in front to make indexing easier in the product prod(j[1:k])
  f <- c()
  for (k in 1:length(num_intervals)) {
    # use lsfi-1 to shift from 1-based indexing to 0-based indexing
    f[k] <- floor((lsfi-1) / prod(j[1:k])) %% num_intervals[k]
  }
  # lsmi = f+1 = level set multi index
  return(f+1) # shift from 0-based indexing back to 1-based indexing
}
to_lsfi <- function(lsmi, num_intervals) {
  # level set multi index (lsmi)
  lsfi <- lsmi[1]
  if (length(num_intervals) > 1) {
    for (i in 2:length(num_intervals)) {
      lsfi <- lsfi + prod(num_intervals[1:(i-1)]) * (lsmi[i]-1)
    }
  }
  return(lsfi)
}
For example, you got a data below
filter_values <- matrix(
  c(1, 2,  # datapoint 1
    3, 1,  # 2
    2, 2,  # ...
    5, 4,
    4, 3),
  ncol = 2, byrow = TRUE
)

cover_points(
  lsfi = 5, # how many points are in 5th interval
  filter_min = c(0, 0), # min value in each dimension, depends on original input data
  interval_width = c(2, 2), # width in each dimension per interval
  percent_overlap = 50,
  filter_values = filter_values,
  num_intervals = c(3, 2), # dim 1 has 3 interval, dim 2 has 2
  type = "stride"
)
lsmi <- to_lsmi(lsfi, num_intervals)
Then, the output will be [1] 1 2 3 , but how? First, it convert the 5th index into multi index, which means the index of interval
lsmi <- to_lsmi(5, c(3, 2)) = [2, 2]Then calculate cover (using stride for example)
stride <- interval_width * (1 - percent_overlap / 100) = c(1, 1)
anchor <- filter_min + (lsmi - 1) * stride = c(1, 1)
lsfmin <- c(1, 1)
lsfmax <-  c(3, 3)
Finally, you can find which points are in [1, 3] x [1, 3], which is in the 5th interval
1, 2  # Y
3, 1  # Y
2, 2  # Y
5, 4  # N
4, 3  # N